

Antarctic sea ice in 2026 and the challenge of predictability
Last month, a journalist asked two questions that sounded simple. How had weather and climate shaped Antarctic sea ice over the past six months? And was climate change playing a role in the longer-term changes we've been seeing? The answers were not simple. And this is exactly why PCAPS was set up.
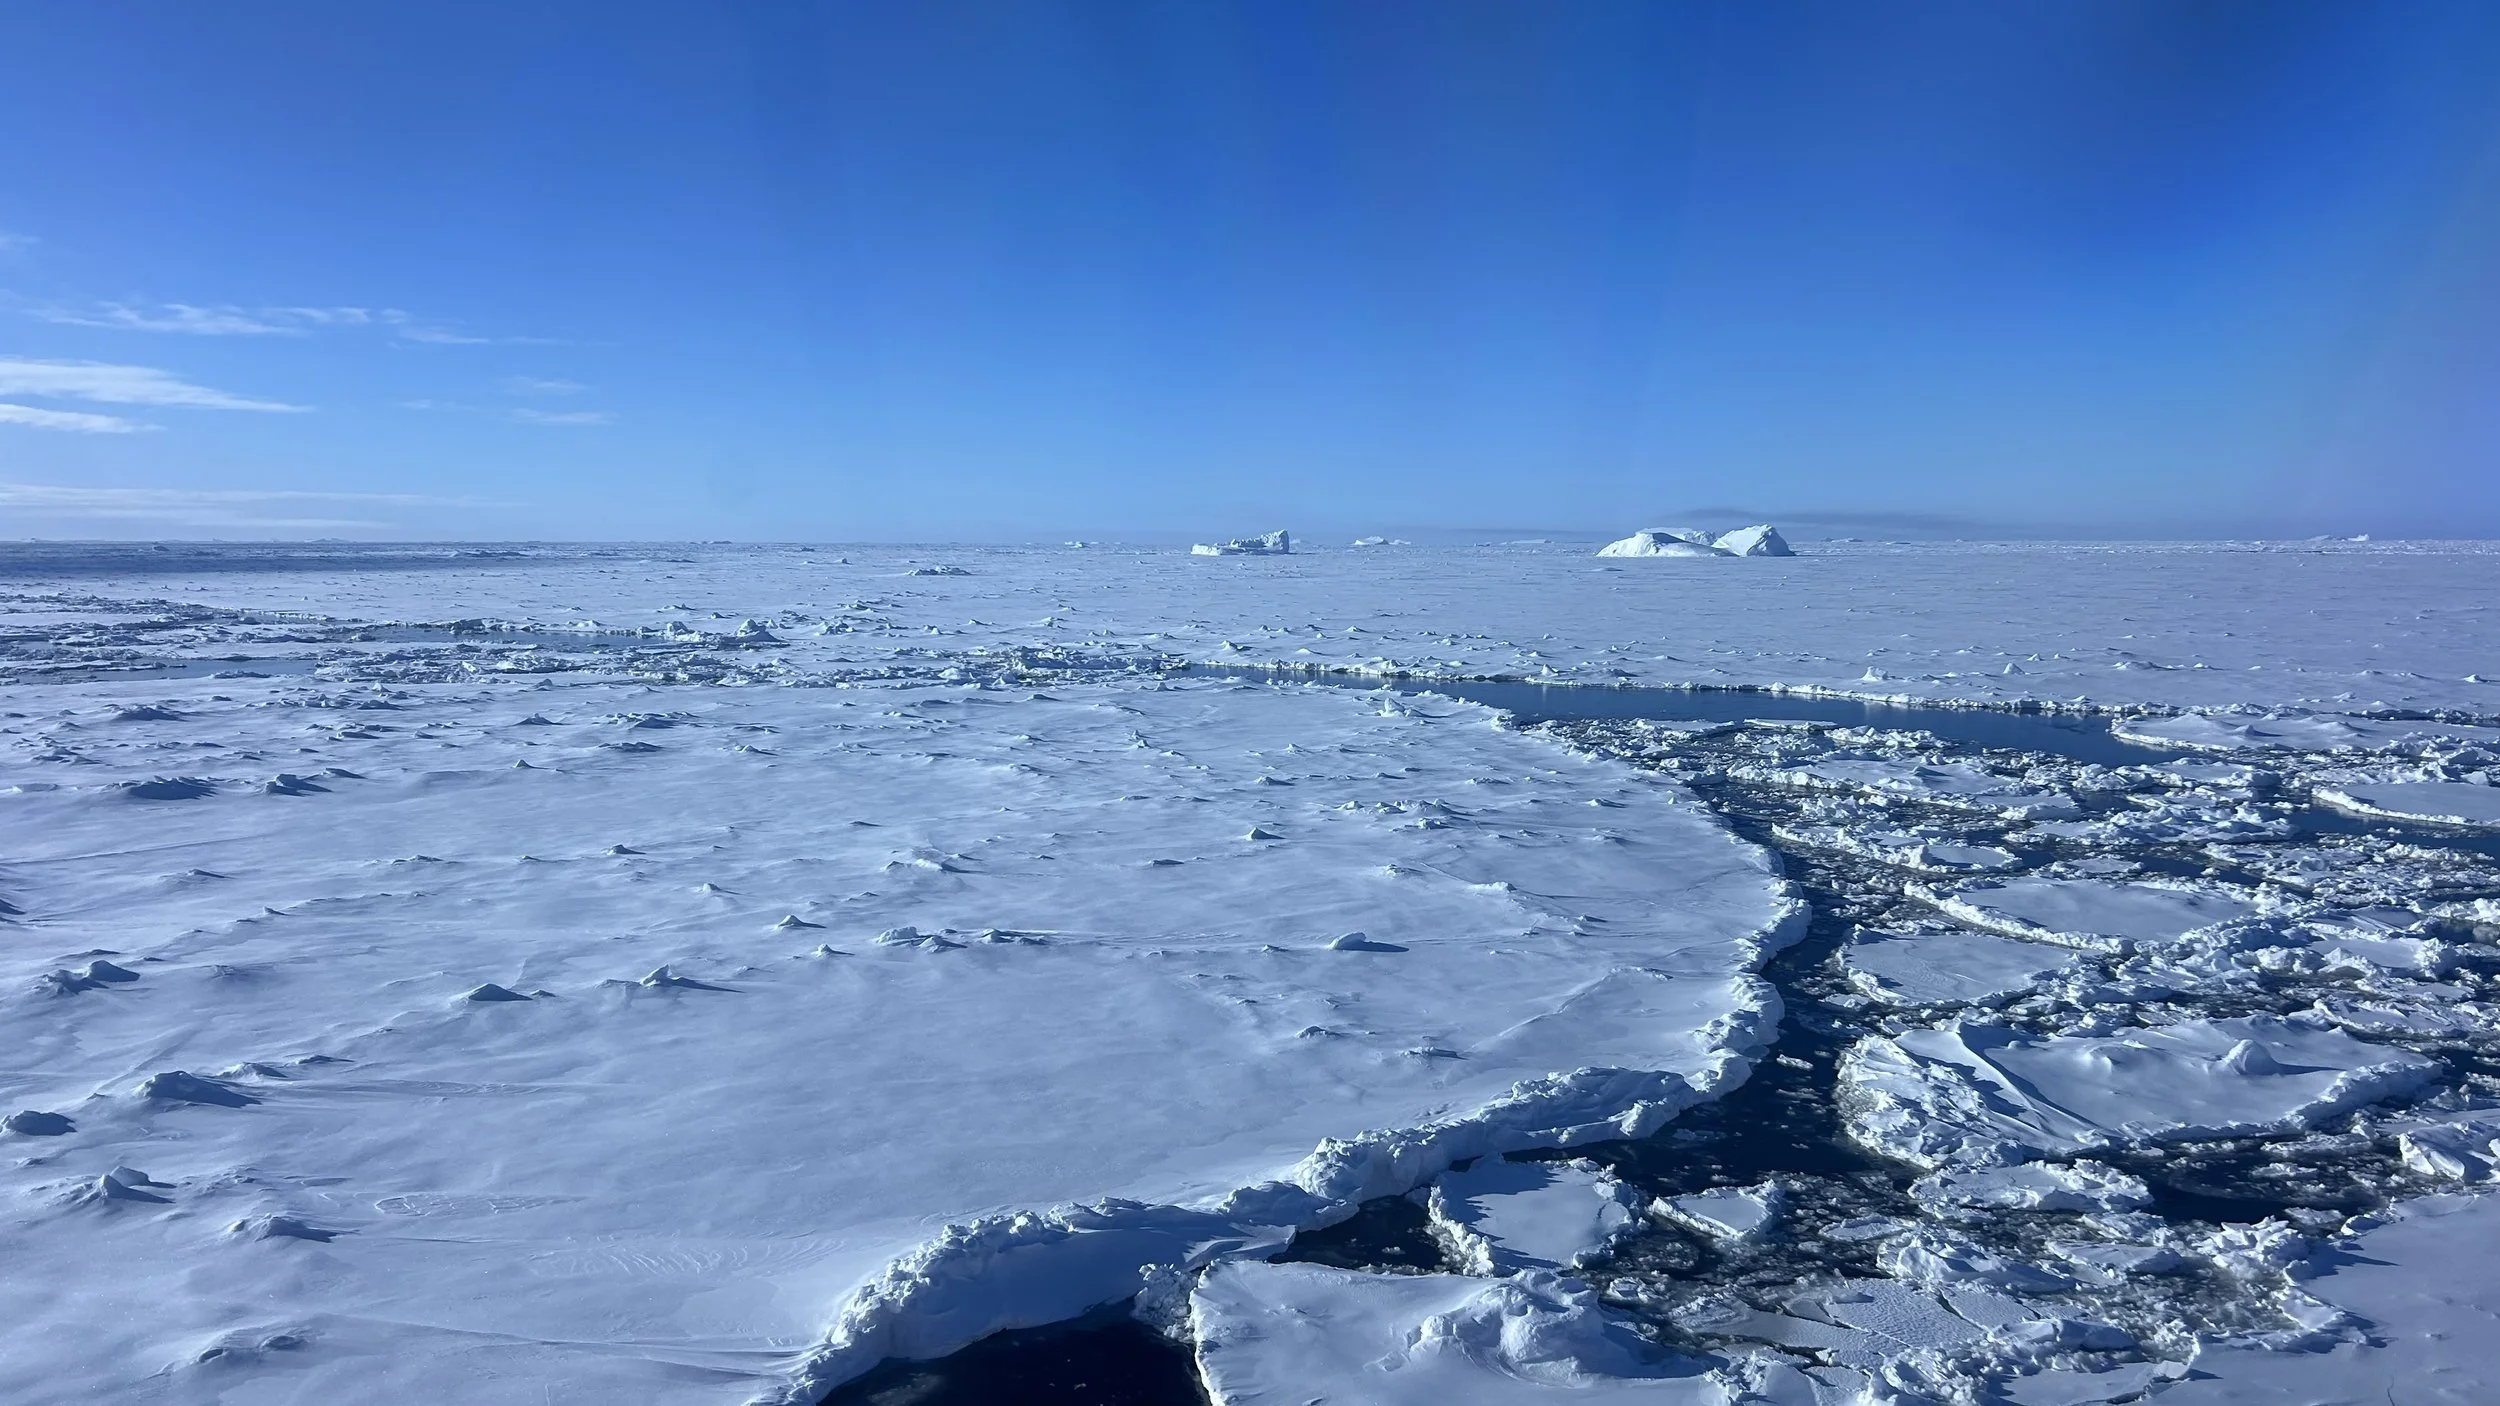
Sea ice in the Amundsen Sea, January 2024. The lead in the foreground (open water where floes have drifted apart) is one of the features that play an important role in how heat, gases and moisture move between the ocean and atmosphere. Icebergs from nearby glaciers are visible in the distance. Photo: Clare Eayrs
While Arctic sea ice has continued its long-term decline, it has been an unusual year in the Southern Ocean. The 2026 summer minimum was shaped by conditions that began during the 2025 winter growth season. In September 2025, Antarctic sea ice reached its winter maximum at 17.81 million km², the third-lowest in the 48-year satellite record. Five months later, at the end of the melt season, the summer minimum came in at 2.58 million km² — the 16th lowest on record, and the closest to the long-term average in four years. But daily sea ice extent stayed close to the mean only until around 20 February, remaining consistently below average through March as seasonal ice growth resumed.
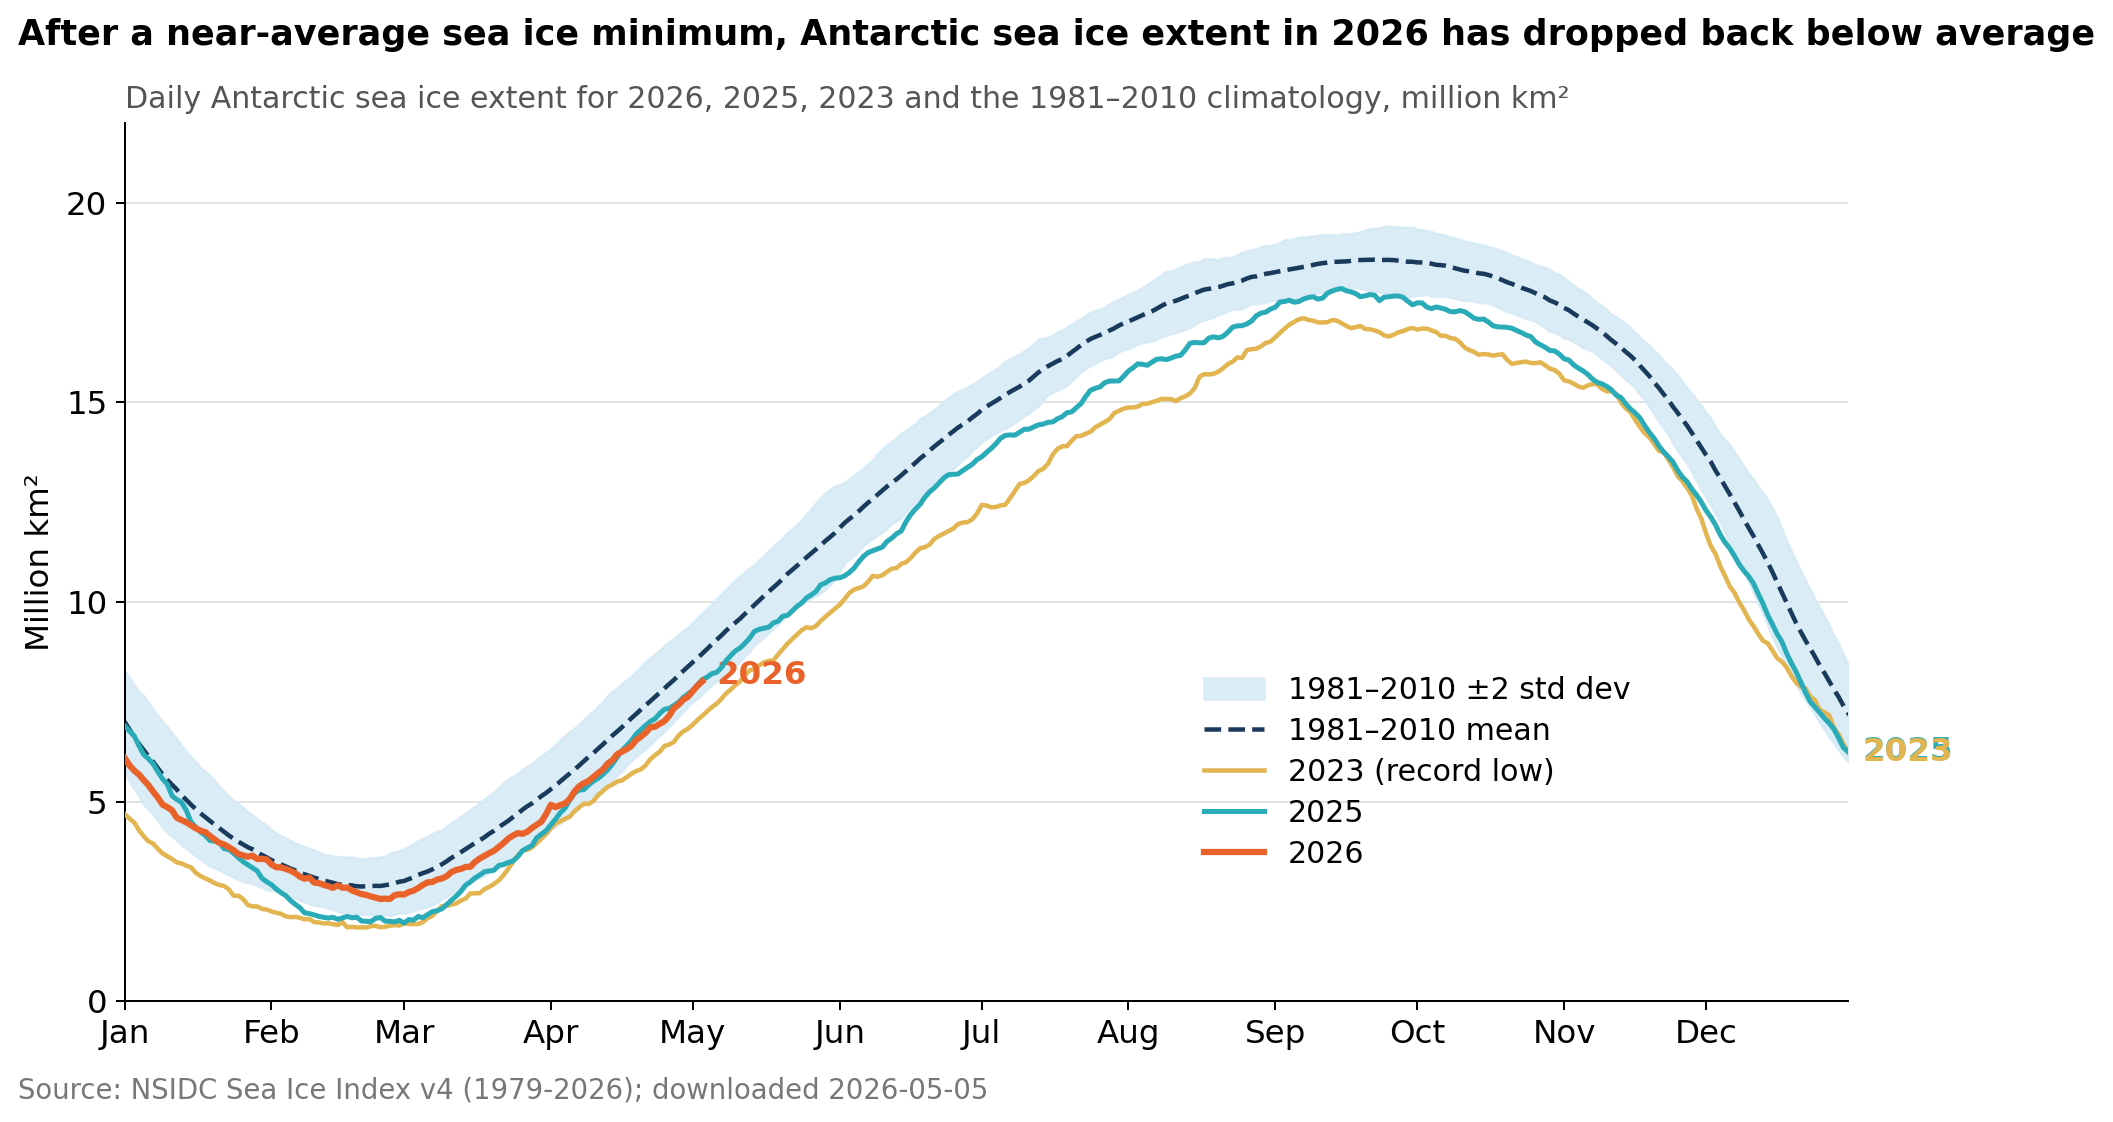
Daily Antarctic sea ice extent for 2025 and 2026 with the record low 2023 and the mean (1981-2010), based on the Sea Ice Index v4 from NSIDC. The 2026 line (red) tracked close to the 1981-2010 mean through January and most of February before dropping below it again.
What happened between winter 2025 and summer 2026
Winter 2025 was shaped by atmospheric circulation. The winds around the continent settled into a pattern called "zonal wave-3", essentially three alternating highs and lows spaced around Antarctica. This is a common configuration, but the highs and lows were unusually strong, pulling warm northerly winds into some sectors and pushing cold southerly winds out of others. The Amundsen Sea Low, a semi-permanent low-pressure system off West Antarctica, was unusually deep, drawing warm northerly winds over the Bellingshausen Sea and suppressing ice growth there, while cold southerlies expanded ice cover in the Ross Sea.
During most of the 2025-26 melt season, Antarctic sea ice remained below average. Then, during January and February 2026, surface winds shifted. Strong southerlies over the Weddell Sea pushed existing ice northward rather than melting it in place, and unusual amounts of summer ice lingered in the northwestern Weddell Sea, the Amundsen Sea, and along parts of the East Antarctic coast. This was largely a wind-driven redistribution rather than new ice forming in these regions, and it was enough to keep the summer sea ice cover much closer to average than in the previous four years. But since then, seasonal ice growth has stayed below average, perhaps indicating another winter of low sea ice cover.
A changed system, not a recovering one
The brief return to near-average extent at the summer minimum was just that -- brief. And the broader conditions that have favoured low Antarctic sea ice in recent years still appear to be in place. Since around 2015, the surface of the Southern Ocean has become saltier, its upper layers less stratified, and subsurface waters have warmed. Together, these changes make it easier for ocean heat to reach the base of the ice and harder for ice to grow and persist. Several recent studies argue that this represents a structural change in the system, characterised by abrupt, self-reinforcing shifts in Antarctic climate, with anomalies persisting for longer and the system less inclined to bounce back.
Is climate change playing a role?
The short answer is likely yes, but the size of the contribution and the exact mechanisms remain hard to pin down. One recent study found the 2023 winter record low was about four times more likely because of human-caused warming. That does not amount to a full attribution of the post-2016 decline, but it makes it harder to argue that recent extremes are simply noise in a naturally variable system.
Antarctic sea ice has always been highly variable, and for much of the satellite era, that variability masked any emerging trend. For the first ~35 years of the satellite record, Antarctic sea ice extent increased slightly, even as most climate models simulated a decline. This mismatch is one reason why Antarctic sea ice has remained a persistent puzzle for the research community. The satellite record is short, and models have long struggled to reproduce the pre-2015 increase in Antarctic sea ice, which makes it difficult to separate anthropogenic forcing from natural variability. While the precise mechanisms are still being worked out, the case that climate change is reshaping both the background state and the likelihood of extreme lows is considerably stronger than it was a decade ago.
What we still cannot see
The sea ice numbers I have been quoting (maxima, minima, extent) all come from passive-microwave satellites that have been watching the Southern Ocean since 1979. Passive microwave satellites are invaluable for tracking sea ice because they provide a long, consistent, near-daily record of sea-ice concentration and extent across both polar regions in all weather and all seasons. They are less suited to resolving narrow bands of landfast ice, the fragmented and wave-affected marginal ice zone, or the thickness of the ice itself.
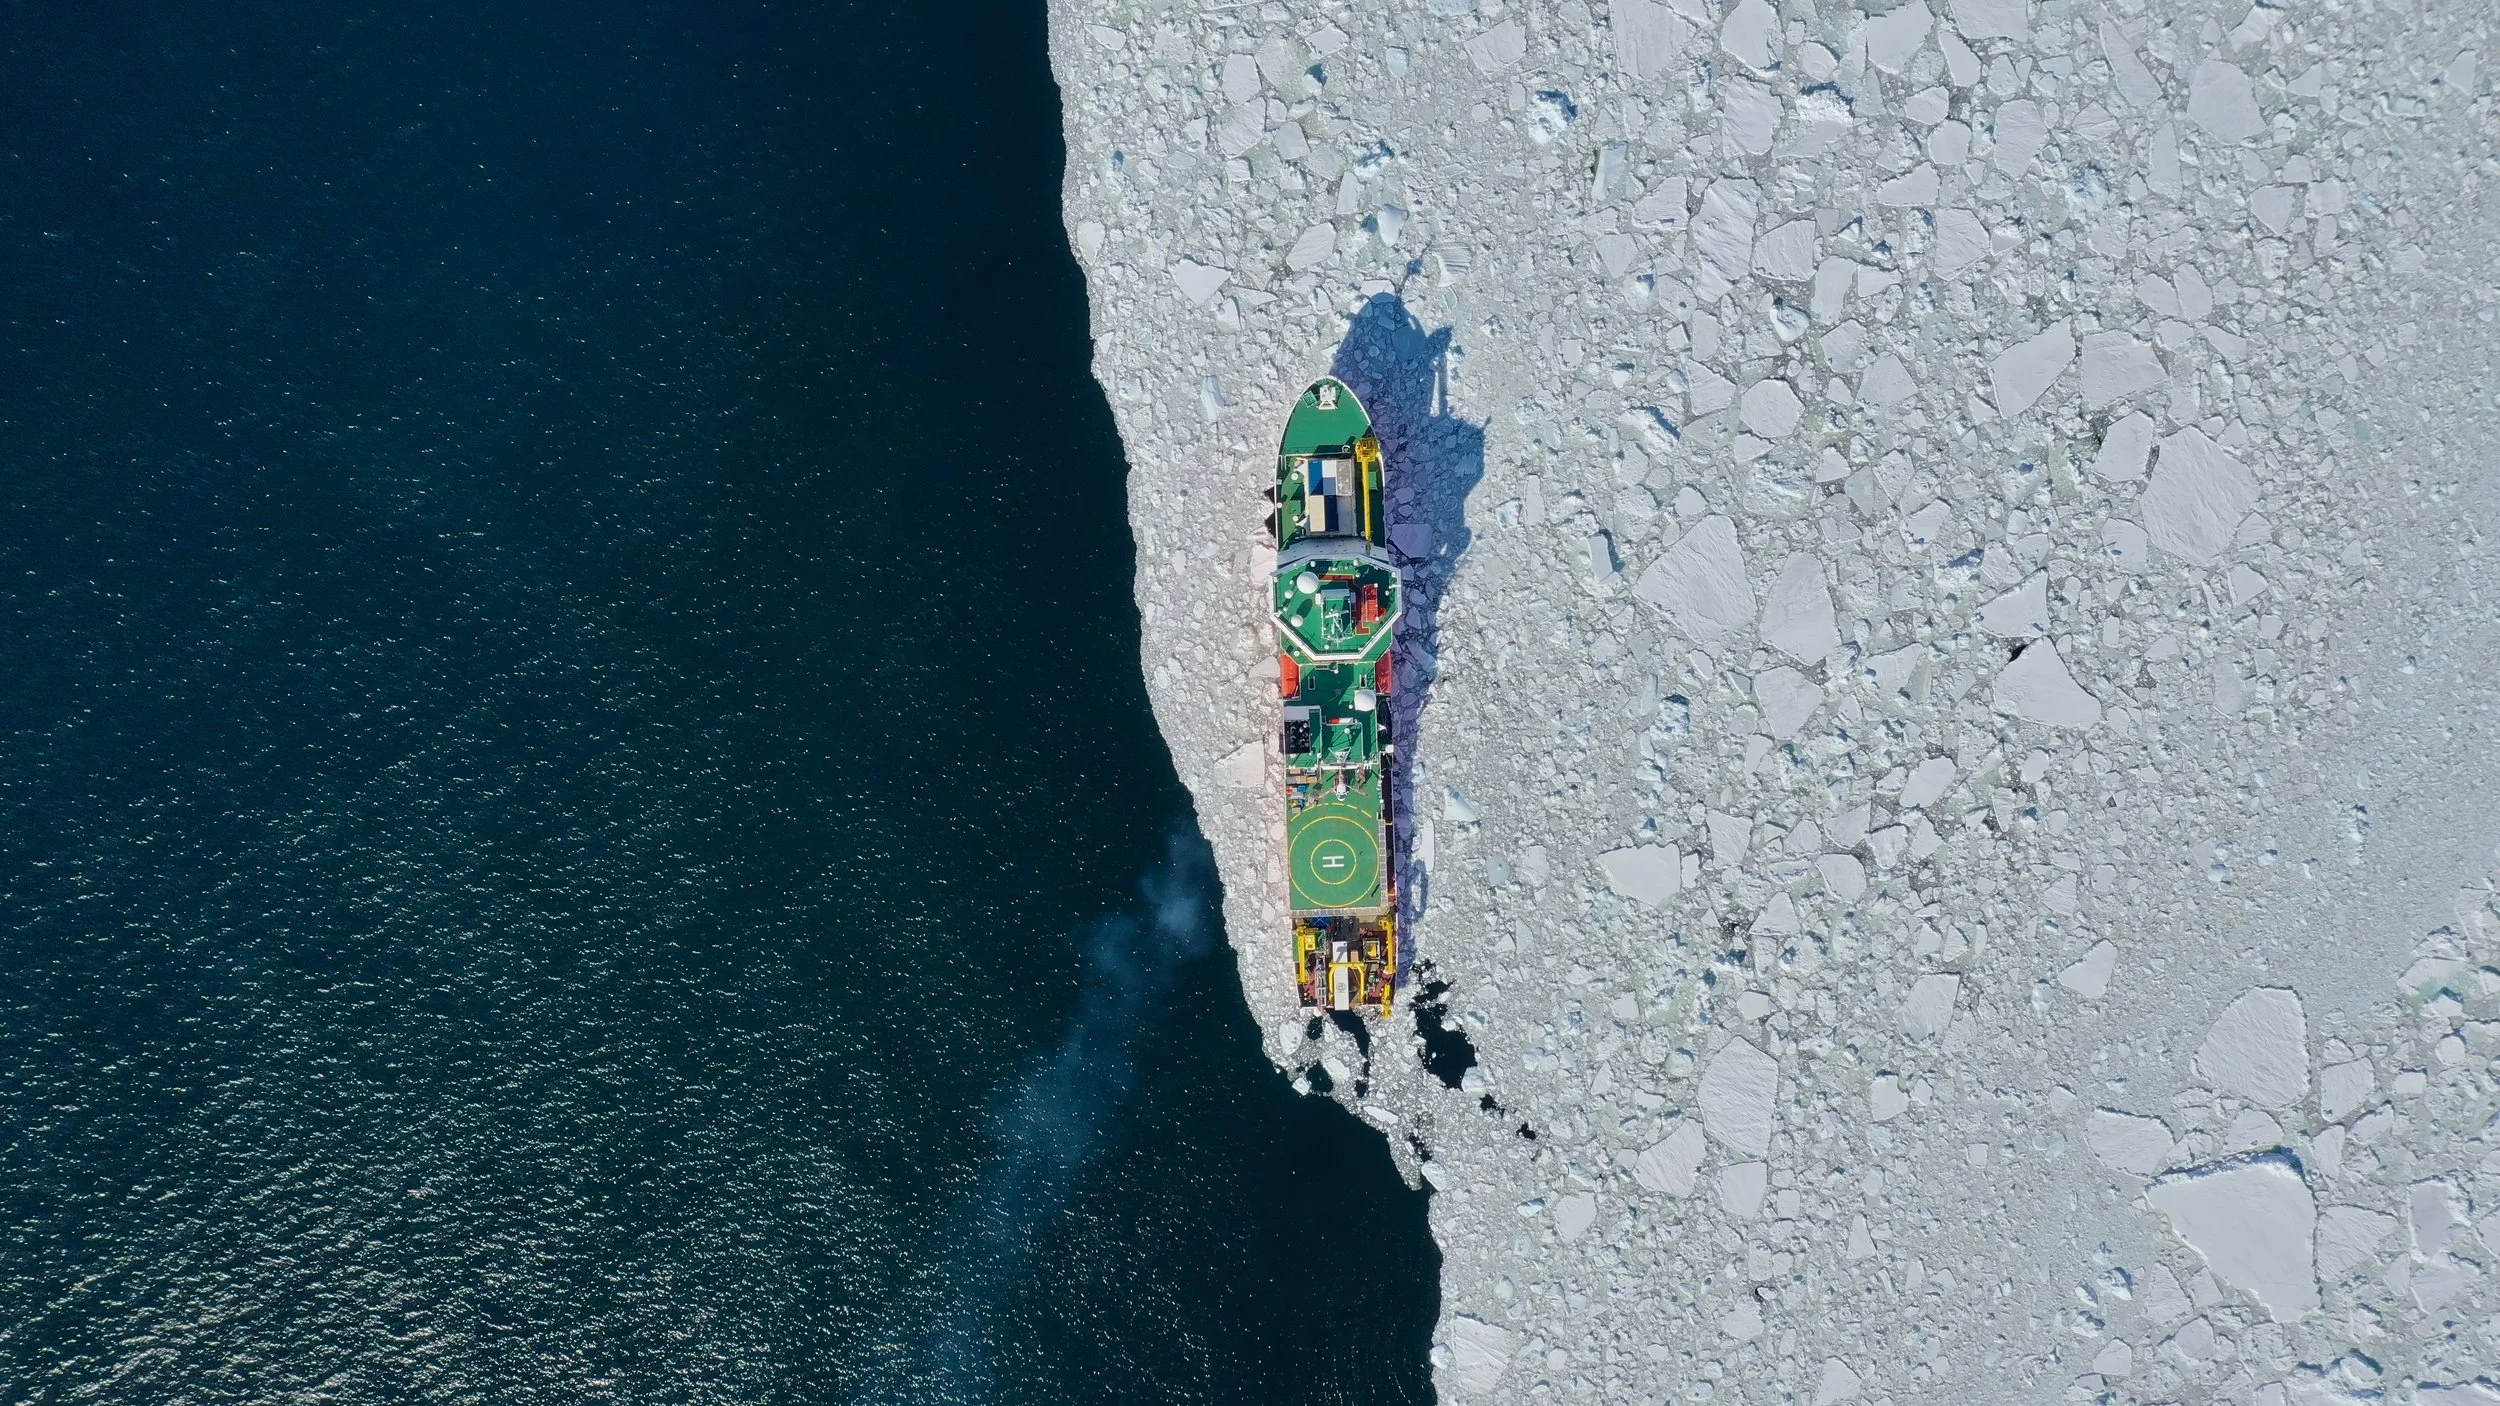
The IBRV Araon working at the sea ice edge in the Amundsen Sea, January 2026. Ship-based campaigns like this remain one of the few ways to make direct measurements of ice thickness, snow depth and ocean properties beneath the ice. Photo: KOPRI
Landfast ice is stationary sea ice anchored to Antarctica's coasts and ice shelves. It accounts for only 4–13% of total Antarctic sea-ice area, but it buttresses ice shelves and glacier tongues, shapes the coastal polynyas where Dense Shelf Water is formed, and underpins emperor penguin breeding. The dramatic circum-Antarctic crash in fast ice in March 2022 had to be reconstructed retrospectively from optical imagery.
Antarctic sea ice thickness is especially hard. Retrievals tuned for the Arctic don't transfer well because Antarctic snow is thicker, wetter, and more complex, and the snow can account for 60–70% of the total freeboard (the height of ice and snow above the waterline that the satellites actually measure). The field is moving, though. SMOS performs well for thin ice, and ESA's new dual-altimetry products combining CryoSat-2 and ICESat-2 are beginning to constrain snow depth directly. Statistical reconstructions of pan-Antarctic thickness from sparse observations and machine-learning techniques are another promising step. But these are still a patchwork. We don't yet have the continuous, validated, multi-decade record that would let us say with confidence whether the ice is thinning as well as shrinking.
While satellite observations of Antarctic sea ice thickness are limited in coverage and consistency, ice-ocean models like GIOMAS can fill that gap by simulating a continuous record using atmospheric reanalysis data to drive sea ice growth and melt processes. But, as Zack Labe explained in his February 2026 blog post, GIOMAS has paused because NOAA terminated the NCEP/NCAR Reanalysis 1 product that it relies on for atmospheric forcing, and recalibrating the model to a different reanalysis will take significant work.
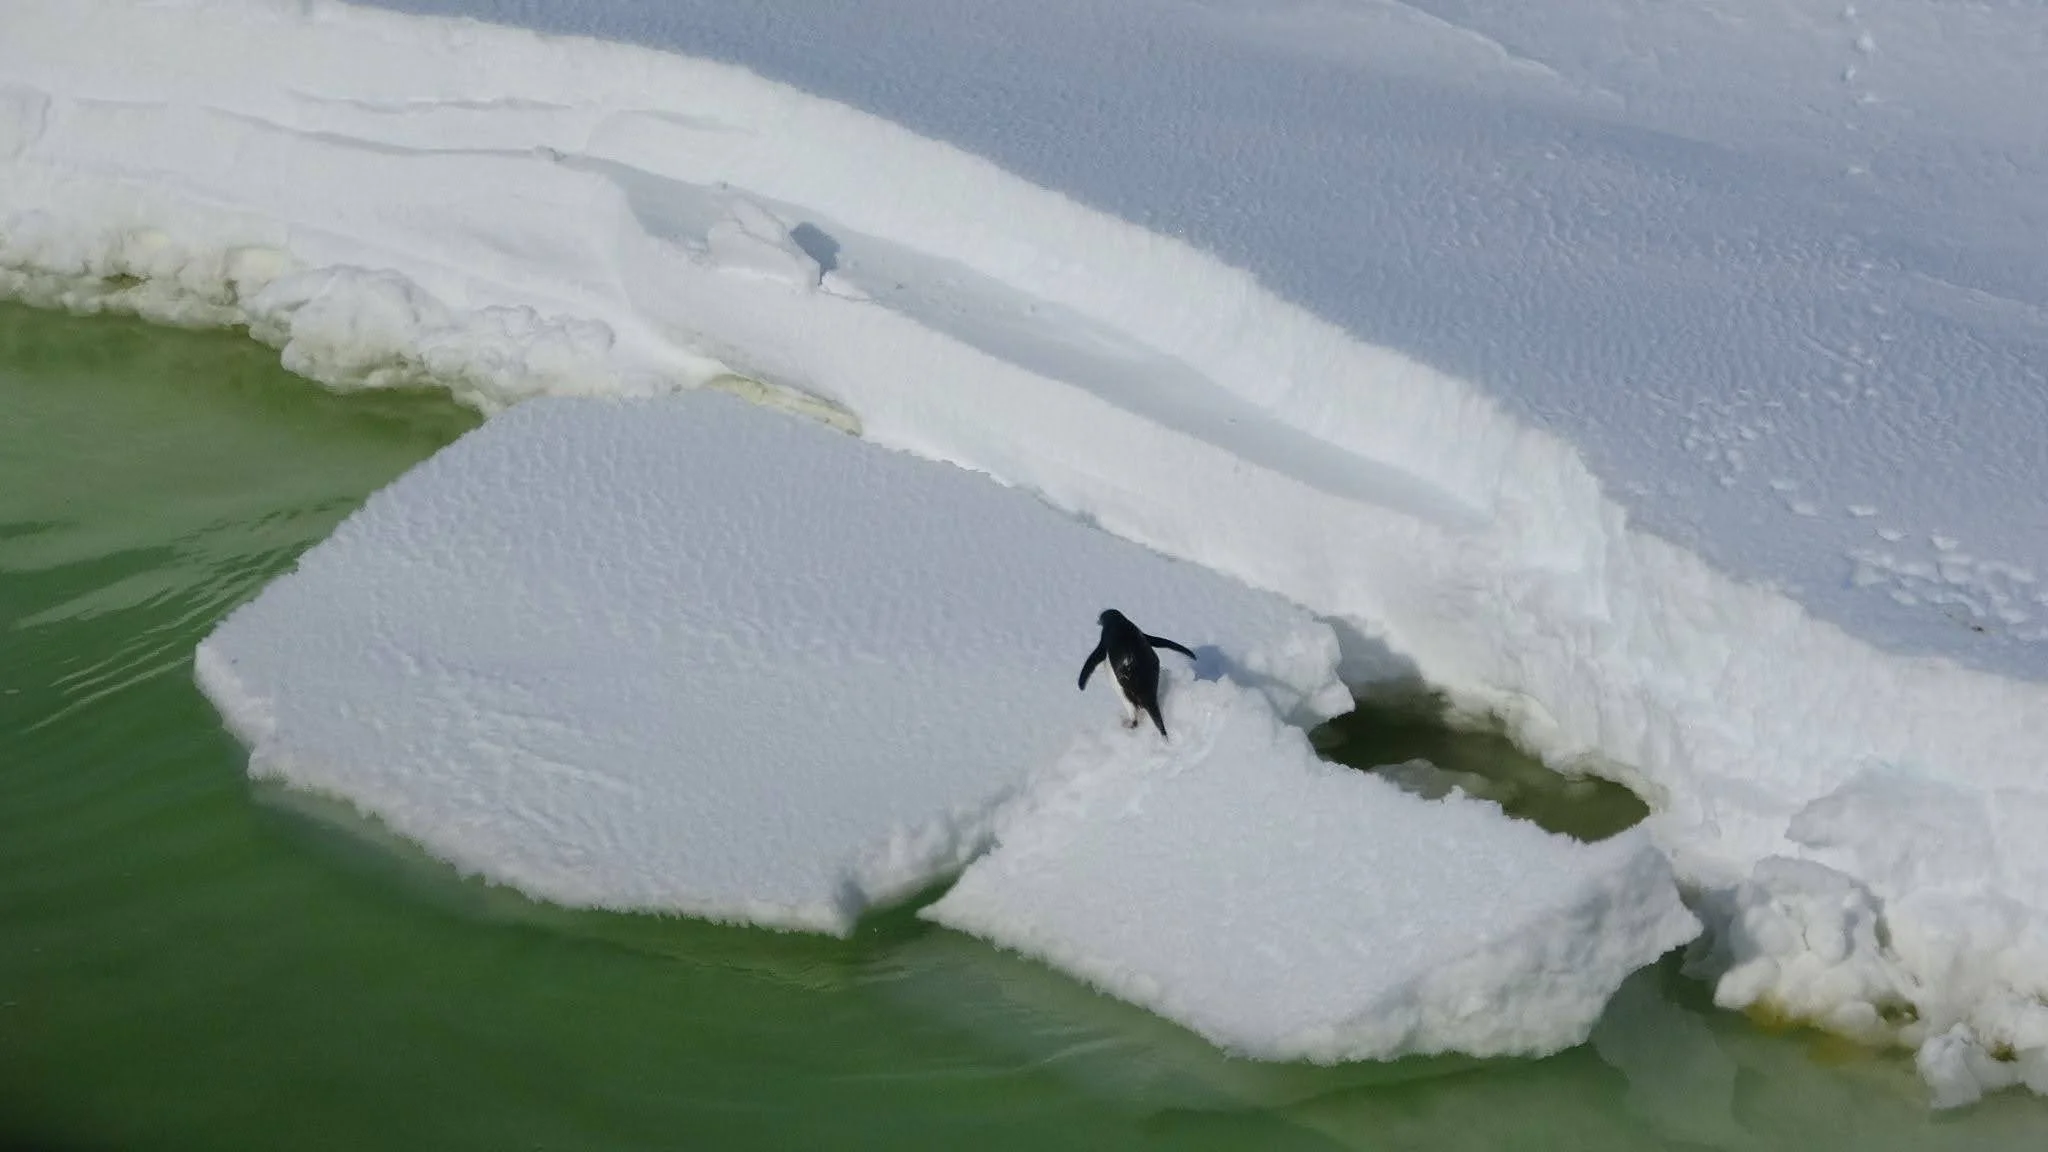
An Adelie penguin on snow-covered sea ice floes in the Amundsen Sea, February 2026. Several Antarctic species depend on sea ice as a platform for breeding, foraging and moulting, one reason changes in sea ice matter beyond the climate system itself. Photo: KOPRI
Why better prediction needs better observations
Sea ice extent is only one property of a system that is changing in multiple dimensions simultaneously. We can describe the near-average summer minimum and the subsequent drop below average, but we cannot say from the satellite record alone whether the ice that formed in autumn was thinner than in previous years, whether the ocean beneath it was warmer, or how the changing atmosphere is driving the system.
These questions bear directly on our ability to predict future sea ice change. Answering them needs observations. Most Antarctic observations are sparse, seasonally biased toward accessible spring and summer conditions, and concentrated in the regions that can most easily be reached. Antarctica InSync (2027-2030) is designed to address this. As a coordinated, multinational programme, it aims to deliver the first year-round circumpolar view of Antarctic sea ice across all sea ice regimes (pack ice, the marginal ice zone, landfast ice and polynyas), combining autonomous instrument networks, ship-based surveys, airborne measurements, and satellite observations. Its central targets are precisely the variables currently missing from the picture: sea ice thickness, snow depth, ice drift and deformation, and the coupled ocean-atmosphere properties that drive growth and melt. Crucially, Antarctica InSync will fold these new observations together with historical records to help us understand how and why Antarctic sea ice is changing.
IPY5 (2032-2033) represents the longer horizon. Building on Antarctica InSync, it offers a once-in-a-generation opportunity to coordinate a sustained step change in Antarctic observing infrastructure. This is where PCAPS comes in. Observations on their own do not produce predictions, and predictions on their own do not produce useful information for the people making decisions on the ice, in shipping lanes, and around the Antarctic treaty table. PCAPS works over the full environmental forecasting value cycle, defining what observations prediction systems need, improving how coupled models use them, and connecting the resulting forecasts to the services that depend on them. A changed Antarctic system needs a prediction system that can keep up.